

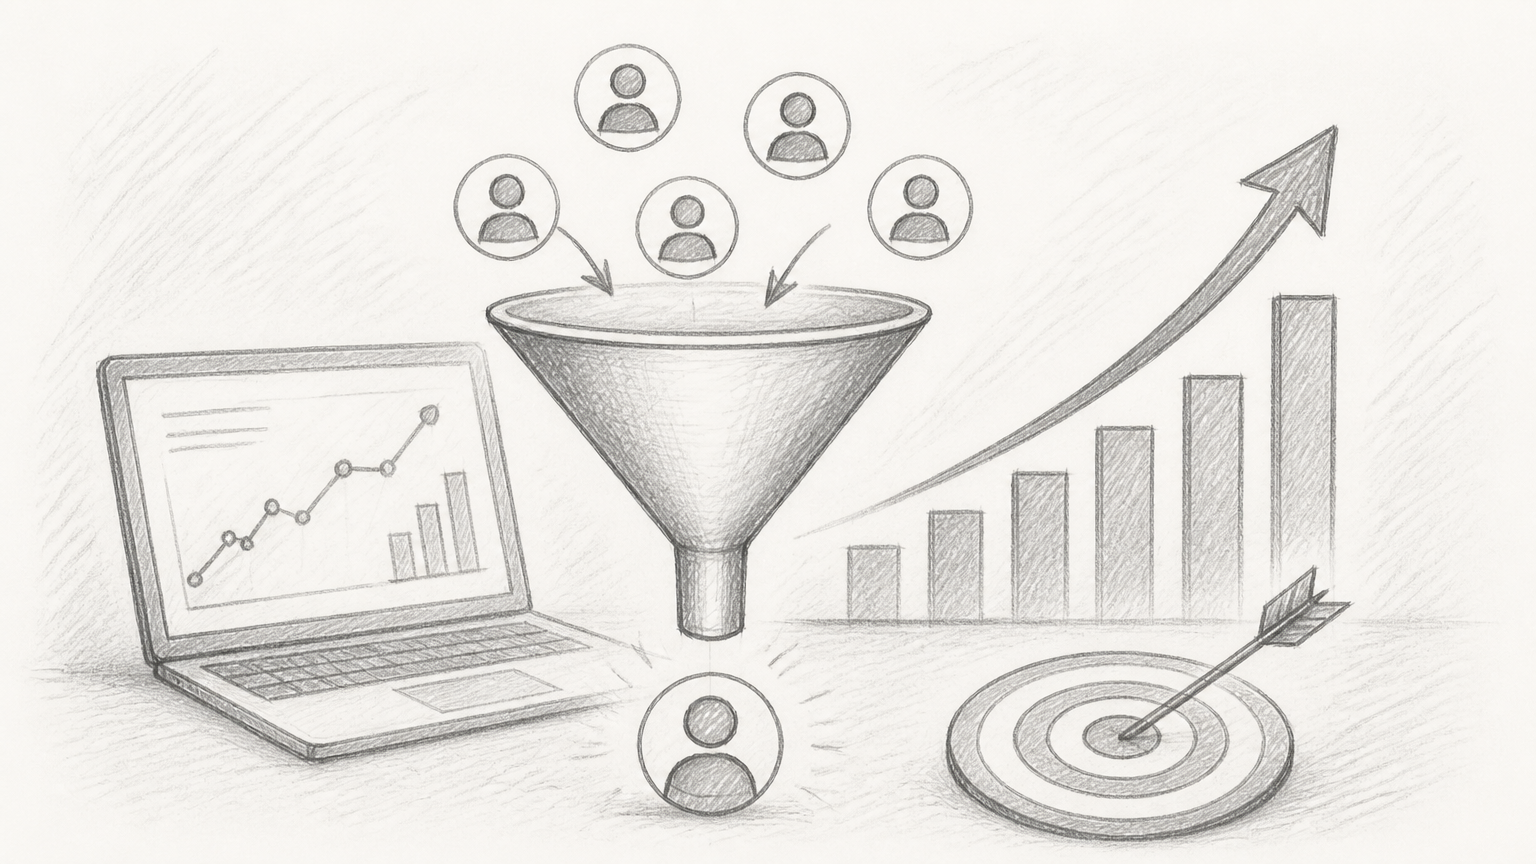
SaaS lead generation got harder before it got smarter. More channels. More tooling. More noise. The old playbook, buy a list, blast outbound, gate a PDF, does not hold up when buyers research in public, ignore generic sequences, and expect relevance from the first touch.
That is why benchmarks matter in 2026. Not as vanity metrics. As operating ranges. You need to know what “good” looks like by stage, channel, and segment so your team can stop debating anecdotes and start fixing the real constraint. Pipeline does not break in one place. It leaks across traffic quality, form conversion, meeting show rates, sales velocity, and expansion readiness.

body 0 79372f05-6e88-4868-b6cf-d50e36f576b0
This guide gives you a practical view of SaaS lead generation benchmarks for 2026, what they mean, where teams misread them, and how to put them to work. If you run growth, own RevOps, support sales, or build the data layer behind go-to-market, this is the baseline you need.
What SaaS lead generation benchmarks look like in 2026
SaaS lead generation benchmarks in 2026 are the performance ranges teams use to judge whether their demand generation engine is healthy. They cover top-of-funnel volume, lead quality, conversion efficiency, speed to follow-up, and contribution to revenue. Good benchmarks do not live in isolation. They connect marketing activity to booked pipeline and closed-won revenue.
That matters because lead generation in SaaS is no longer just about collecting contacts. For many companies, especially in B2B SaaS, the real job is to create qualified demand across multiple buying signals: product usage, firmographic fit, intent data, inbound requests, partner activity, and outbound engagement. A benchmark is only useful if it reflects that reality.
Why 2026 benchmarks are different from older SaaS baselines
The big shift is that volume-first reporting is losing ground to efficiency-first reporting. Teams care less about raw MQL counts and more about metrics like cost per qualified opportunity, demo-to-pipeline conversion, inbound speed-to-lead, and pipeline generated per full-time marketer.
AI also changed the mechanics. It is easier to produce content, launch outbound sequences, and test ad creative. That means average output went up. It does not mean average quality improved. In fact, many teams saw response rates drop because prospects are overloaded with competent-looking but forgettable outreach. In 2026, benchmarks need to separate activity from impact.
The benchmark categories that matter most
The cleanest way to think about lead generation benchmarks is by motion. Inbound-led SaaS teams care about website conversion, trial starts, demo requests, and product-qualified leads. Outbound-led teams care about contact rates, reply rates, positive response rates, meeting-booked rates, and opportunity creation per rep. Hybrid teams need both views, plus a unified definition of what counts as a qualified handoff.
Here is a practical benchmark table for SaaS teams in 2026. These are directional operating ranges, not universal laws. Segment, ACV, market maturity, and sales motion will move them.
Metric | Early-stage SaaS | Growth-stage SaaS | Enterprise SaaS | What it tells you |
Website visitor-to-lead conversion | 1.5% to 3.5% | 2% to 4.5% | 1% to 3% | Whether traffic and offers are aligned |
Landing page conversion for high-intent offers | 8% to 18% | 10% to 22% | 6% to 15% | Whether messaging matches intent |
Demo request-to-meeting booked | 45% to 70% | 50% to 75% | 40% to 65% | Process quality and lead screening |
Trial signup-to-PQL | 10% to 25% | 12% to 30% | 8% to 20% | Product activation and fit |
MQL-to-SQL conversion | 20% to 40% | 25% to 45% | 15% to 35% | Lead scoring quality |
SQL-to-opportunity conversion | 25% to 50% | 30% to 55% | 25% to 45% | Sales qualification effectiveness |
Lead response time for inbound | Under 15 min | Under 10 min | Under 30 min | Conversion leverage from speed |
Cold email positive reply rate | 1% to 4% | 2% to 5% | 1% to 3% | Message relevance and targeting |
Outbound meeting booked rate | 0.5% to 2% | 1% to 3% | 0.5% to 1.5% | Prospecting efficiency |
CAC payback on self-sourced demand | 10 to 18 months | 8 to 16 months | 12 to 24 months | Economic sustainability |
These ranges are useful because they anchor reality. If your visitor-to-lead rate is 0.6%, you likely have a traffic quality issue, a weak offer, or a page problem. If your MQL-to-SQL rate is 12%, the issue may be lead scoring, audience fit, or a qualification gap between marketing and sales. The benchmark does not diagnose the problem by itself. It tells you where to look first.
Key aspects of SaaS lead generation benchmarks in 2026
Traffic quality matters more than traffic volume
A lot of SaaS teams still overvalue sessions. That worked better when paid acquisition was cheaper and buyers converted faster. In 2026, traffic without intent is just hosting cost plus reporting noise. The stronger benchmark is not “How much traffic did you buy?” It is “What share of traffic converted into qualified pipeline?”
This is where segmentation sharpens the picture. Organic branded traffic will often convert very differently from paid social traffic. Review-site traffic behaves differently from partner referrals. Developer audiences can browse heavily and convert late. Finance buyers might convert on fewer visits but with a stronger commercial signal. One blended benchmark hides these differences.
Funnel stage definitions are now a competitive advantage
If one team defines an MQL as any ebook download and another defines it as a hand-raiser from a target account, their benchmarks are not comparable. This sounds basic, but it is still one of the most common reasons benchmark reviews go nowhere. Teams compare numbers, not definitions.
The 2026 standard is stricter. Qualified stages should reflect buying probability, not just engagement. That usually means using a mix of explicit fit signals, behavior, and timing. A lead from a target segment who requested pricing or hit a product usage threshold should count more than a generic content download from an unqualified domain.
Inbound speed is still one of the highest-leverage metrics
There are not many lead generation variables you can improve in a week and see immediate revenue lift. Speed-to-lead is one of them. The benchmark remains aggressive because buyer intent decays fast. If someone asks for a demo and waits four hours for a reply, your competitor may already be in the conversation.

body 1 5151861c-6572-41ec-8f3e-b7f9714000ea
The operational lesson is simple. Treat high-intent inbound like support severity, not like a marketing queue. Route it fast. Score it instantly. Notify the owner in real time. If your benchmark is good on lead volume but bad on meeting-booked rate, the first fix is often response design, not more spend.
Channel benchmarks diverge sharply by SaaS motion
PLG SaaS companies often accept lower lead capture rates because product entry is the main conversion event. Sales-led enterprise SaaS usually needs fewer leads but much stronger qualification. Vertical SaaS teams can see higher conversion from smaller traffic pools because the problem-solution fit is tighter. Horizontal SaaS may need more education and more touches.
That is why channel-level benchmarks matter. Content syndication, paid search, partner co-marketing, outbound SDR, LinkedIn thought leadership, comparison pages, free tools, and product-led acquisition all produce very different economics. Looking at one blended cost per lead across all of them is a fast way to misallocate budget.
The table below shows how benchmark expectations often differ by channel in B2B SaaS.
Channel | Typical lead quality | Conversion speed | Cost efficiency | Best use case |
Organic search | Medium to high | Medium | High over time | Capture existing demand |
Paid search | High intent, variable fit | Fast | Moderate to expensive | Bottom-funnel demand capture |
Paid social | Low to medium intent | Slower | Variable | Category education and retargeting |
Review sites | High | Fast | Expensive but efficient | Buyers in active evaluation |
Outbound email | Medium, depends on targeting | Medium | Efficient if disciplined | Create demand in target accounts |
Partner marketing | High | Medium | Very efficient | Reach trust-based audiences |
Free tools/calculators | Medium to high | Medium | High if adoption sticks | Generate intent and links |
Product-led signup | High if activation is strong | Fast | Efficient at scale | Convert users through experience |
Benchmarks must connect to revenue, not just lead status
This is where many dashboards still fall short. They stop at MQLs, SQLs, or booked demos. But the market does not pay you for stage progression. It pays you for pipeline and revenue. In 2026, the benchmark that matters most is the relationship between lead generation and downstream outcomes.
A healthy model usually shows clear ratios between lead, qualified meeting, opportunity, pipeline, and win. Those ratios will differ by motion, but they should be stable enough that you can forecast. If your top-of-funnel metrics look strong while pipeline remains flat, your benchmark system is broken or your qualification threshold is too loose.
Data hygiene is no longer optional
Lead generation reporting is only as reliable as the event model under it. Duplicate records, broken UTMs, weak identity resolution, delayed syncs between product and CRM, and muddy attribution windows distort benchmarks fast. The result is fake precision. A dashboard that looks sophisticated but sends the team in the wrong direction.
For data teams, this is the hidden benchmark behind all the others: Can you trust the numbers enough to act on them? If not, fix taxonomy, ownership, and source mapping before arguing over conversion rates.
How to interpret benchmarks without misusing them
Benchmarks are guardrails, not goals by themselves. If you force your team to hit an industry-average lead volume target without regard for ACV, niche, or buying cycle, you can easily destroy efficiency. More leads can mean worse pipeline if quality drops.
A better approach is to use benchmarks as ranges, then compare your actuals by segment. For example, a developer-focused infrastructure product may convert fewer top-of-funnel visitors than a simple SMB SaaS tool, but produce stronger product-qualified leads and better retention. A benchmark should help you explain that difference, not erase it.
Watch the denominator
This is a simple point that saves a lot of confusion. Conversion rates change when your denominator changes. Visitor-to-lead, lead-to-MQL, MQL-to-SQL, and account-to-opportunity are all valid. They are not interchangeable. Teams often celebrate improvement at one stage while ignoring deterioration upstream or downstream.
If your MQL-to-SQL rate rises from 28% to 41%, that sounds excellent. But if lead volume fell because traffic quality collapsed, your total SQL count may still be down. Always inspect both rate and count. Efficiency and output need to move together.
Separate benchmark by segment, motion, and ACV
A self-serve PLG motion and an enterprise outbound motion should not share one benchmark stack. Even inside one company, SMB, mid-market, and enterprise often behave like different businesses. Their deal cycles, stakeholders, lead sources, and qualification rules differ too much.
In practice, the cleanest reporting split is usually by:
Segment: SMB, mid-market, enterprise
Motion: inbound, outbound, partner, product-led
Offer type: trial, demo, contact sales, webinar, tool
Source quality: branded, non-branded, paid, referral, direct
That structure gives you enough resolution to make budget calls without drowning in noise.
How to get started with SaaS lead generation benchmarks in 2026
The fastest path is not to build a giant dashboard first. Start by agreeing on stage definitions and the few ratios that actually drive planning. If marketing and sales do not trust the same qualification logic, no benchmark will survive first contact with a weekly pipeline meeting.
Begin with your existing funnel. Map lead creation, qualification, meeting booked, opportunity creation, and closed-won. Then calculate baseline conversion rates over the last two to four quarters. Do this by segment, source, and motion. You are not looking for perfection. You are looking for the true shape of your engine.
Build a benchmark model you can operationalize
A useful benchmark framework is compact. It should tell your team where volume enters, where quality is filtered, and where revenue emerges. In most SaaS environments, that means choosing a small set of primary metrics and treating everything else as diagnostic.
A solid starting scorecard usually includes website visitor-to-lead conversion, cost per qualified lead, MQL-to-SQL conversion, SQL-to-opportunity conversion, inbound response time, meeting show rate, and pipeline generated per source. For product-led teams, add activation rate and product-qualified lead rate. For outbound-heavy teams, add positive reply rate and meeting-booked rate per account list.
Set targets as ranges, not single numbers
Single-number targets create weird behavior. Teams game them. They over-optimize one stage and harm another. A benchmark range is better because it reflects uncertainty and gives room for learning. If your target SQL-to-opportunity rate is 35% to 45%, the conversation becomes diagnostic. Why are you at 31% this month? Why did enterprise improve while mid-market slipped?
That framing creates better operating discipline. It encourages teams to test and learn instead of defending a brittle dashboard.
Start with a short implementation checklist
Use this sequence to get the basics right fast:
Define stages: Lock MQL, SQL, PQL, opportunity, and sourced pipeline definitions.
Clean the data: Fix duplicate leads, source mapping, UTMs, and CRM ownership rules.
Segment reporting: Break benchmarks by motion, segment, and channel.
Set ranges: Use historicals plus market expectations to define healthy bands.
Review monthly: Track variance, investigate outliers, and adjust with evidence.
This looks simple because it should be. The point is to create a system your team will actually use.
Common mistakes when benchmarking SaaS lead generation
The first mistake is copying another company’s numbers without context. A category-creating startup, a mature cybersecurity platform, and a vertical SaaS tool for dental practices do not share the same benchmark logic. Similar labels. Different buying behavior.
The second mistake is over-crediting one source because attribution is incomplete. Many inbound demo requests are influenced by dark social, founder content, partner mentions, and product word of mouth. If your benchmark framework ignores these touches, paid search can look better than it really is and content can look worse than it is.
The third mistake is chasing cost per lead instead of cost per qualified pipeline. Cheap leads are often expensive distractions. Strong teams know the difference.
What strong teams do differently in 2026
They shorten feedback loops. They do not wait a quarter to understand lead quality. They connect campaign data, CRM progression, and product signals quickly enough to change targeting, offers, and follow-up while the campaign is still running.
They also design for signal capture. Every form field, enrichment source, usage event, and routing rule exists for a reason, not to collect more data, but to increase the probability that the next action is correct. Better benchmarks come from better systems, not better spreadsheet formatting.
Conclusion
SaaS lead generation benchmarks for 2026 are less about chasing bigger lead counts and more about building a reliable demand engine. The best teams benchmark quality, speed, conversion, and revenue contribution together. They segment aggressively. They define stages clearly. They trust ranges more than vanity averages.
Your next step is practical. Audit your funnel definitions, calculate baseline conversion rates by source and segment, and compare them against healthy operating ranges. Then fix the weakest link first, not the loudest metric, the one that moves qualified pipeline. That is how benchmarks become decisions, and decisions become growth.
Learn more about SaaS Lead Generation.
Written by
Bastian W.
Content Manager / ManyPI