


SaaS growth stalls for a simple reason more often than teams admit, they use the wrong benchmark for their stage. A seed-stage company measuring itself like a $10 million ARR business will think pipeline is broken when the real issue is maturity. A Series B team using seed-stage expectations will underinvest, miss targets, and call it efficiency.
That is why lead generation benchmarks by ARR stage matter. They give you context. Not vanity metrics, not recycled industry averages, but a practical way to judge whether your funnel is healthy for the business you actually are today.
This guide breaks down SaaS lead generation benchmarks from Seed through Series B, with clear numbers, caveats, and what to do next.
What SaaS lead generation benchmarks by ARR stage really mean
SaaS lead generation benchmarks by ARR stage are reference points that help you compare demand generation performance against companies with similar revenue maturity. The key phrase here is revenue maturity. Two companies with the same headcount can have completely different benchmarks if one is at $500K ARR and the other is at $8M ARR.
ARR stage affects almost everything in the funnel. Your brand awareness is different. Your pricing is different. Your buyer profile is usually broader or narrower. Your sales motion may still be founder-led at Seed, then shift into SDR plus AE ownership by Series A, then become segmented by customer size at Series B. Those changes reshape what “good” looks like.
This is also why broad B2B SaaS averages can mislead you. A top-of-funnel conversion rate pulled from a mixed dataset of PLG tools, enterprise platforms, and vertical SaaS products is not a useful operating number unless you normalize for stage, deal size, sales cycle, and channel mix. Benchmarks are only valuable when they are interpreted in context.
ARR stage changes the funnel math
At Seed, most teams are still searching for message-market fit, channel fit, and a repeatable ICP. Lead volume may be low, but quality can be high because founders are hand-holding the process. Conversion rates can look surprisingly strong in narrow channels and weak everywhere else. That is normal.
At Series A, the question shifts from “Can we generate demand?” to “Can we do it consistently without founder heroics?” The benchmark focus becomes source mix, marketing-qualified lead quality, pipeline coverage, and sales efficiency. You are no longer testing whether a market exists. You are testing whether your engine can scale.
By Series B, predictability matters more than isolated wins. Leadership wants pipeline models that hold up month after month. Benchmarks now need to include channel diversification, CAC payback discipline, inbound versus outbound contribution, and the conversion health of each stage from lead to closed-won.
The benchmark categories that matter most
The strongest benchmark frameworks track a few core dimensions instead of dozens of disconnected metrics. Lead volume matters, but only relative to traffic, target account quality, and downstream conversion. Cost per lead matters, but only when matched against sales-qualified opportunity rates and payback.
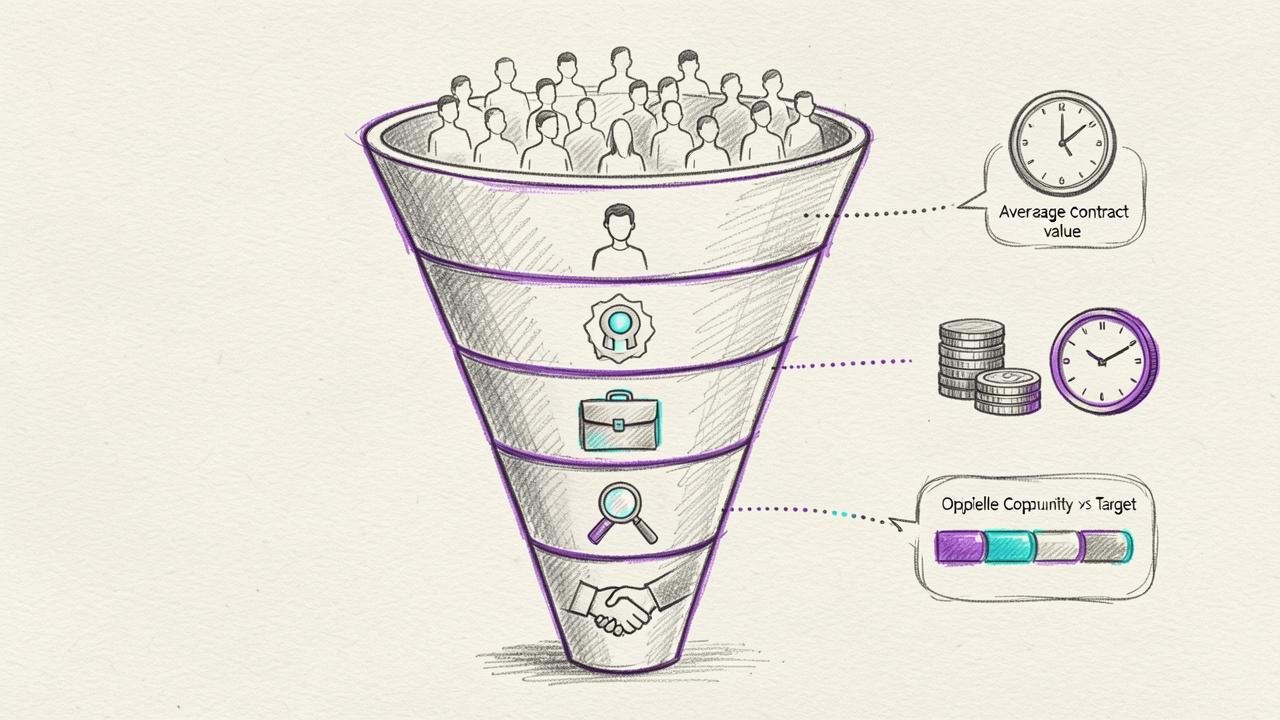
You should think in five benchmark layers: website visitor-to-lead conversion, lead-to-MQL or PQL conversion, MQL-to-SQL conversion, SQL-to-opportunity conversion, and opportunity-to-close rate. Around that funnel, you also need supporting benchmarks for sales cycle length, average contract value, and pipeline coverage against ARR targets.
body 1 b5f15f77-dbe5-474a-a443-b042acbbfe8b
Key aspects of lead generation benchmarks from Seed to Series B
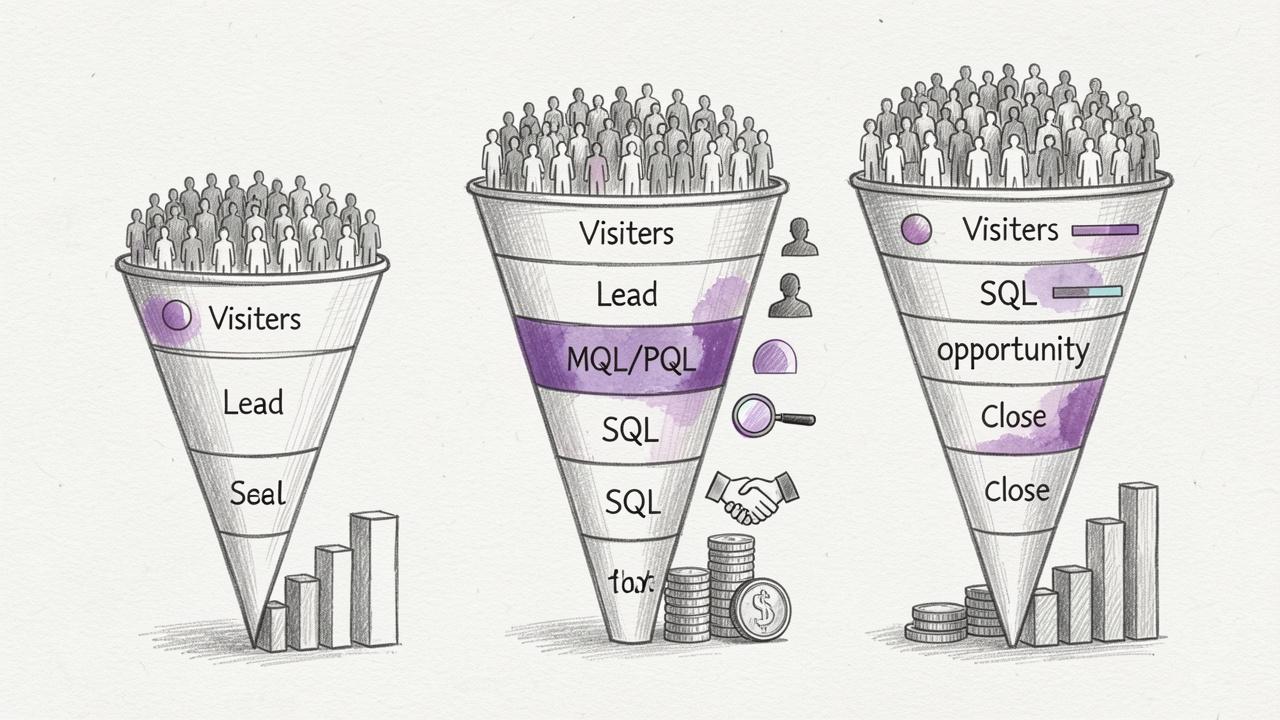
The biggest mistake in SaaS benchmarking is treating all growth stages as one market. They are not. A company at $300K ARR has a very different go-to-market reality from one at $12M ARR. Here is how the benchmark picture changes by stage.
Here is how the benchmark picture changes by stage.
body 0 3572bb17-6a73-449d-bf2e-ccb12898d1a6
Seed stage benchmarks, roughly $0 to $1M ARR
At Seed, lead generation is usually uneven. Some months are driven by founder networks, communities, partner intros, and a handful of high-intent inbound demos. Other months are driven by experimentation that produces more noise than pipeline. That variability is expected.
A typical Seed-stage SaaS business often sees monthly website traffic under 10,000 visits unless the product has strong community or SEO traction. Visitor-to-lead conversion commonly falls in the 1% to 3% range for broader content-led sites and 3% to 7% for high-intent demo pages with clear ICP alignment. Lead-to-opportunity conversion can be wide, often 5% to 15%, because qualification is manual and definitions are still loose.
Seed teams should pay close attention to speed of learning more than raw lead count. If you generate 150 leads in a month but only two match your ideal customer profile, you do not have a lead generation win. You have a targeting problem. At this stage, strong benchmarks usually show up as concentrated quality in one or two channels, not broad success across ten.
Early Series A benchmarks, roughly $1M to $5M ARR
By Series A, the company is usually expected to show repeatability. Marketing starts to own a larger share of pipeline creation. Founders are still involved, but less as the primary conversion layer and more as escalation support for strategic deals.
At this stage, website traffic often reaches 10,000 to 50,000 monthly visits for companies with active content, paid acquisition, or ecosystem distribution. Visitor-to-lead conversion often stabilizes around 1.5% to 4%, depending on whether the funnel is product-led, sales-led, or hybrid. MQL-to-SQL conversion often falls in the 20% to 35% range for well-targeted inbound, while outbound-sourced positive reply rates may land around 3% to 8% depending on market sophistication and list quality.
Pipeline creation becomes the core benchmark. A healthy Series A motion often targets 3x to 5x pipeline coverage against near-term new ARR goals. If your quarterly new ARR target is $500K, you likely need $1.5M to $2.5M in qualified pipeline, adjusted for win rates and deal timing. That sounds obvious, but many teams still back into lead goals without anchoring them to revenue math.
Series B benchmarks, roughly $5M to $20M ARR
At Series B, your lead generation engine should be more diversified and measurable. Inbound cannot be the only growth lever. Outbound cannot be tolerated if it fails efficiency thresholds. Paid acquisition needs better attribution. Partnerships need clearer sourced and influenced pipeline tracking.
Monthly traffic often exceeds 50,000 visits, though this varies sharply by ACV and enterprise focus. Visitor-to-lead conversion can range from 1% to 3% on mixed-intent sites and go higher on tightly structured product or demo funnels. MQL-to-SQL conversion often lands in the 25% to 40% range when routing and qualification are disciplined. SQL-to-opportunity conversion may sit around 40% to 60%, and opportunity-to-close can range from 15% to 30%, heavily influenced by deal size and procurement complexity.
The stronger benchmark at Series B is not just conversion. It is consistency. Can you produce enough qualified pipeline with acceptable CAC payback, without relying on one channel or one star rep? If not, your growth model is still fragile.
A benchmark table you can actually use
The numbers below are directional. They are not laws of physics. But they are useful planning ranges for B2B SaaS teams evaluating lead generation by ARR stage.
ARR Stage | Typical GTM Motion | Monthly Site Traffic | Visitor-to-Lead | Lead-to-SQL / Opportunity | Opp-to-Close | Pipeline Coverage Target |
Seed ($0 to $1M) | Founder-led, early inbound, light outbound | 1K to 10K | 1% to 7% | 5% to 15% | 15% to 35% | 2x to 4x |
Series A ($1M to $5M) | Early team-led inbound and outbound | 10K to 50K | 1.5% to 4% | 10% to 25% lead-to-SQL, 20% to 35% MQL-to-SQL | 15% to 30% | 3x to 5x |
Series B ($5M to $20M) | Multi-channel, segmented GTM | 50K+ | 1% to 3% | 25% to 40% MQL-to-SQL, 40% to 60% SQL-to-opportunity | 15% to 30% | 3x to 6x |
The ranges widen because SaaS business models widen. A self-serve collaboration tool and a compliance platform selling into banks should not share identical assumptions. Use the table as a calibration point, then tighten it with your own ACV, sales cycle, and funnel structure.
Channel mix matters as much as headline volume
Not all leads are created equal. Organic search, branded search, communities, partner referrals, review sites, outbound prospecting, webinars, and paid social each produce different downstream outcomes. A stage-appropriate benchmark needs to account for source quality.
Seed companies often overvalue volume from low-intent content because it feels scalable. Series A teams often overvalue MQL counts because they need reporting structure. Series B teams often overvalue attribution neatness because finance asks for certainty. In each case, the fix is the same, measure channels by qualified pipeline contribution, not just top-funnel throughput.
A smaller lead source that converts to opportunity at 18% can easily outperform a larger source converting at 2%. That is why serious teams benchmark source-level efficiency, not just blended rates.
ACV changes what “good” looks like
If your average contract value is $3,000 a year, you need much more lead volume than a company selling $40,000 annual contracts. That sounds basic, but teams still import benchmark numbers without adjusting for deal economics.
Lower-ACV SaaS models usually need stronger visitor-to-trial or visitor-to-demo conversion, tighter onboarding, and lower-cost acquisition channels. Higher-ACV businesses can tolerate lower top-funnel conversion if the ICP is narrow and win rates downstream are strong. In other words, benchmark quality should rise as volume expectations fall.
Product-led versus sales-led benchmarks diverge quickly
A product-led SaaS company may treat signups, activations, and PQLs as the real funnel. A sales-led company may rely on demo requests, outbound meetings, and account qualification instead. If you compare those motions using the same lead definitions, you will get nonsense.
For product-led companies, activation rate often matters more than MQL rate. For sales-led businesses, account penetration and meeting quality matter more than trial starts. The benchmark framework should match the actual path to revenue, not the labels inside your CRM.
How to get started with SaaS lead generation benchmarks by ARR stage
You do not need a perfect RevOps stack to benchmark well. You need clean definitions, revenue alignment, and the discipline to stop mixing unlike metrics. Start there.
Step 1, define your stages clearly
Most benchmark projects fail at naming. Marketing says “lead.” Sales says “qualified.” Product says “active.” Finance says “pipeline.” Everyone is technically correct and operationally useless.
Start by defining each stage in plain language. What counts as a lead? What qualifies as an MQL, PQL, SQL, or opportunity? What action moves a record from one stage to the next? Keep the definitions strict enough to be useful and simple enough to survive handoff between tools and teams.
A short alignment checklist helps:
Lead definition: Decide what form fills, signups, or captured contacts count.
Qualification rule: Set the threshold for MQL, PQL, or SQL movement.
Opportunity criteria: Agree on when a deal is truly pipeline.
Revenue linkage: Tie every stage to closed-won reporting.
Without that structure, your benchmarks will drift every quarter.
Step 2, benchmark backward from ARR goals
Do not start with “How many leads do we need?” Start with “How much new ARR do we need?” Then work backward through win rate, opportunity volume, qualified meetings, and lead creation.
If your Series A company needs $2M in new ARR next year, has a $20K ACV, and closes 20% of qualified opportunities, you need about 100 closed deals. That implies 500 opportunities. If your SQL-to-opportunity rate is 50%, you need 1,000 SQLs. If your visitor-to-lead and lead-to-SQL math says that requires 80,000 annual visitors, your benchmark work just turned into a channel planning exercise.
That is the point. Good benchmarks convert abstract goals into operating requirements.
Step 3, segment by source before you optimize
Blended conversion rates hide the truth. You should benchmark by channel, by campaign type, and often by ICP segment. The paid search lead that converts in 10 days behaves differently from the community referral that closes in 45. Treating them as one average leads to bad budget decisions.
At minimum, split your benchmarks across inbound, outbound, partner, organic, and paid. If your motion is more mature, segment by SMB, mid-market, and enterprise. That is where real performance differences show up.
Step 4, adjust for sales cycle and attribution lag
One of the most common benchmarking errors happens when teams compare same-month leads to same-month revenue. That works in almost no B2B SaaS environment beyond very low ACV self-serve sales.
Seed teams may close deals in a few weeks. Series B teams selling to larger accounts may need 60 to 180 days or longer. That means your benchmark review window must align with actual sales velocity. Otherwise, promising channels look broken simply because they have not had time to mature into pipeline and revenue.
Step 5, use ranges, not fantasy precision
A benchmark is a management tool, not a prophecy. If your stage-appropriate visitor-to-lead benchmark is 2% to 4%, there is no prize for planning around 3.37%. Use ranges that reflect reality.
This matters even more when seasonality, product launches, pricing changes, and territory shifts distort short-term data. Your goal is not to create a spreadsheet that appears scientific. Your goal is to make better decisions faster.
A practical benchmark scorecard
If you want one operating view, use a compact scorecard that connects funnel health to stage expectations.
Metric | Seed Target Range | Series A Target Range | Series B Target Range | Why It Matters |
Visitor-to-Lead | 1% to 7% | 1.5% to 4% | 1% to 3% | Shows offer clarity and traffic quality |
MQL/PQL-to-SQL | N/A to 25% | 20% to 35% | 25% to 40% | Measures qualification strength |
SQL-to-Opportunity | 30% to 60% | 35% to 55% | 40% to 60% | Reflects sales discipline and ICP fit |
Opportunity-to-Close | 15% to 35% | 15% to 30% | 15% to 30% | Connects pipeline to actual revenue |
Pipeline Coverage | 2x to 4x | 3x to 5x | 3x to 6x | Tests whether growth targets are realistic |
This kind of scorecard works best when reviewed monthly for trend direction and quarterly for strategic resets.
Common mistakes when using ARR-stage benchmarks
Benchmarks help when they are used as decision support. They hurt when they become a substitute for strategy.
Mistaking more leads for better growth
A jump in lead volume can hide a decline in quality. This happens all the time after content expansion, aggressive paid campaigns, or relaxed form gating. The dashboard looks better. The pipeline does not.
If you are below target on downstream conversion, volume is not the first fix. Tighten ICP, sharpen the offer, improve routing, and remove channel waste. More low-intent leads will only make sales slower and attribution messier.
Ignoring stage transition effects
A company moving from late Seed into Series A often experiences a temporary dip in conversion rates. Why? Because the business is shifting from founder intuition to team process. New reps are learning. New channels are being tested. Handoffs are less fluid.
That dip is not always a sign of failure. Sometimes it is the cost of becoming scalable. The right benchmark lens accounts for transition periods instead of assuming each quarter should improve linearly.
Using external benchmarks to avoid internal truth
External SaaS lead generation benchmarks are useful. But your own historical cohorts matter more once you have enough data. If your last four quarters show that partner-sourced leads close twice as fast as paid inbound, that insight should outrank any generic industry average.
The best teams use market benchmarks as a starting frame, then build company-specific benchmarks that get sharper over time.
Conclusion
SaaS lead generation benchmarks work when they match your ARR stage, GTM motion, and deal economics. Seed companies need proof and learning. Series A companies need repeatability. Series B companies need predictable, efficient pipeline. The numbers change because the business changes.
Your next step is simple. Audit your funnel definitions, map your current conversion rates, and compare them against stage-appropriate ranges. Then trace everything back to ARR goals. Once you do that, benchmark conversations stop being abstract. They become operational, measurable, and useful. Learn more about SaaS Lead Generation.
Written by
Bastian W.
Content Manager / ManyPI